The Data
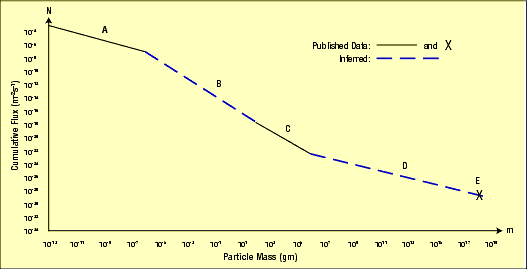
How much meteoritic material is striking the Moon? More specifically, how many particles (N) greater than a certain mass (m) pass through a square meter on the Moon’s surface each second? This is called the cumulative flux. The data are usually reported on a logarithmic coordinate system as shown in Figure 178, because so many more smaller particles strike the Moon than larger particles.
Particle sizes vary widely. Solar wind blows most particles smaller than 10-13 gram out of the solar system. At the other extreme are large crater-forming meteorites. Measurements exist for the influx of meteoritic material in three regions across this broad range. The first will be called Region A; the second will be called Region C; and the last will be called Point E. Regions B and D are interpolated between these known regions and are shown as the blue dashed lines in Figure 178.
Region A is based on impacts registered on a satellite 0.98–1.02 astronomical units from the Sun.2 The curve for Region A is
log NA = –10.08 – 0.55 log m (10–13 < m < 10–6 gm)
Seismometers placed on the Moon provided the data for Region C.3 The results, again where NC is the number of particles per square meter per second that are greater than mass m, were
log NC = –15.12 – 1.16 log m (102 < m < 106 gm)
The equation for Region B is obtained by finding the line that joins the far right point in Region A with the far left point in Region C. That equation is
log NB = –14.77 – 1.33 log m (10–6 < m < 102 gm)
Point E is based on the fact that “there are 125 structures [craters] on the Moon with diameters greater than 100 km.” 4 The diameter of a large meteorite, impacting at typical velocities, is about 12% of its crater’s diameter. If the density of meteorites is 3 gm/cm3, then the mass of a meteorite that could form a crater 100 km in diameter would be

The Moon’s surface area is 3.8 × 10¹³ m2. If the largest 125 meteorites struck the Moon during the last 4.6 × 10⁹ years, then the average cumulative flux at Point E is

Point E connects to Region C by the curve
log ND = -18.91 - 0.53 log m (106 < m < 2.7 × 10¹⁸ gm)
The task now is to integrate the total mass of meteoritic material in Regions A, B, C, and D. To do this, we must convert these cumulative flux curves to the thickness of meteoritic material.
